
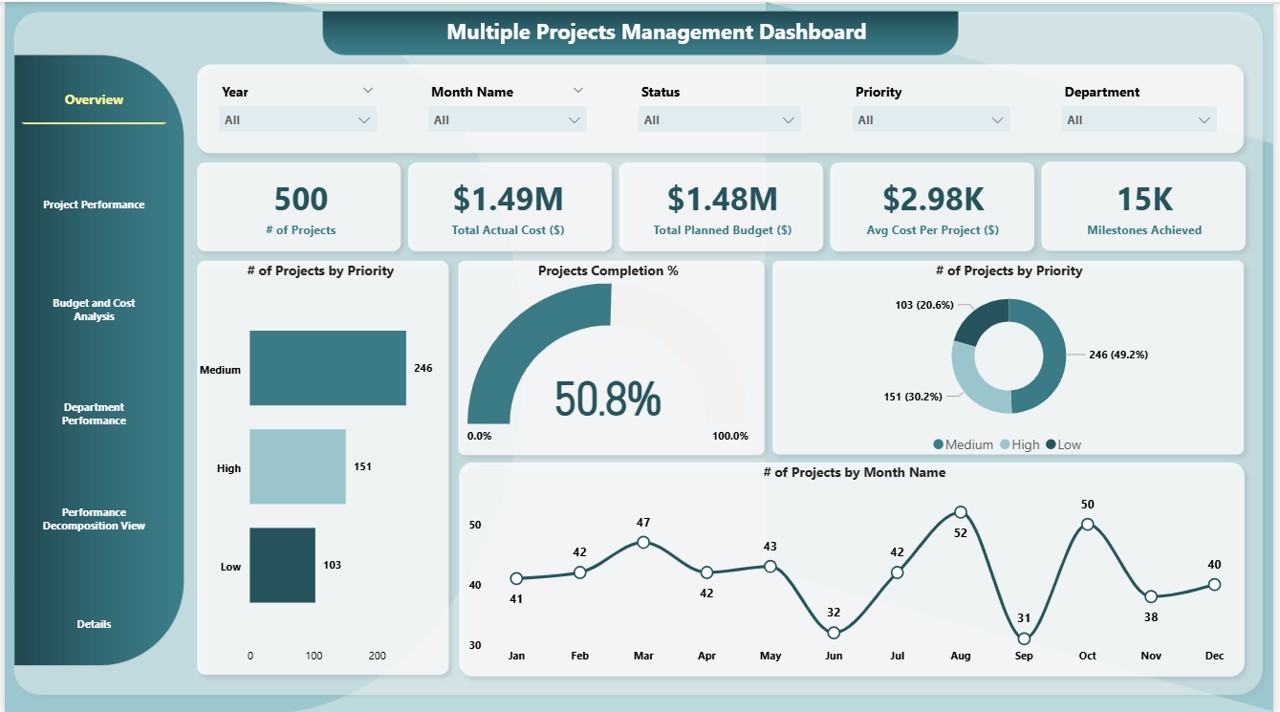
Every Friday afternoon, in a lot of small UK businesses, somebody builds the pack. Sales figures come out of one system and costs out of the accounts package, staff hours get copied from a rota spreadsheet, and by about half past four there’s a workbook with a dozen tabs ready for Monday’s management meeting. It works, and the person who builds it usually knows the business numbers better than anyone else in the building. It also takes a good chunk of their week, and the figures are a few days old by the time anyone discusses them.
Official figures suggest there’s plenty of room to get more out of that data. In the government’s 2026 business data survey, 86% of UK firms said they hold data in digital form, but just a quarter go on to analyse it for insight. A large international study by Oracle found that 70% of business leaders and employees had abandoned a decision at least once because they felt swamped by the data. Bringing the key figures together on one live page makes them far quicker to act on.
What changes when the pack becomes a dashboard
Microsoft Power BI is the reporting tool that many small firms already have access to through their Microsoft 365 subscriptions. It connects to the same sources the pack draws on, including accounting software, sales systems and spreadsheets stored on SharePoint, and refreshes them automatically on a schedule. The report your team opens on Monday then shows figures as of that morning, and anyone with access can click into a region or a single week without waiting for someone to rebuild a tab.
Meetings change too. When everyone looks at the same live page, discussion moves on from checking the numbers and towards deciding what to do about them. A director who wants to know why margin dipped in the North West can filter to it there and then. And the person who used to assemble the pack each Friday gets that time back for analysis, where their knowledge of the business adds the greatest value.
Moving across without disrupting the business
A gradual move works well. Start with the one or two tabs everyone reads first, typically sales against target and cash, and rebuild those in Power BI while the old pack carries on alongside. After a month of running both, the team trusts the new figures because they’ve watched them match, and the remaining tabs can follow one at a time.
Under the surface, some groundwork decides whether a dashboard lasts. The data needs cleaning on the way in, which Power BI handles in a tool called Power Query, so that a customer spelt three ways in three systems becomes one customer. The tables need linking in a sensible data model, the structure that tells Power BI how sales, customers, products and dates relate to each other. Calculations such as margin, year-on-year growth or month-to-date sales are then written in DAX (Data Analysis Expressions), the formula language Power BI uses. A capable spreadsheet user can learn all of this, and they’ll learn it much faster with proper teaching.
It also pays to agree definitions before building anything. Does a sale count when the order is taken, when it ships or when the invoice goes out? Is margin calculated before or after delivery costs? Spreadsheet packs often carry these rules in the head of the person who builds them, and moving to Power BI is a good moment to write them down and get the directors to sign them off. Once a definition sits in the data model, every page and every person uses it consistently, and the Monday meeting can start straight on the figures.
Access needs a little thought as well. A management dashboard may hold salary costs or customer margins that not everyone should see. Power BI can restrict what each person sees through a feature called row-level security, so the operations team and the board can open the same report and each see the figures appropriate to them. Setting this up early saves an awkward conversation later.
Who should build it
The person who builds the pack today is usually the right person to build its replacement. They know where every number comes from, which exceptions matter and what the directors will ask. What they generally need is a couple of days of structured training to apply that knowledge in a new tool.
Red Eagle Tech, the Whetstone-based Microsoft Partner in North London, runs a two-day live Power BI Masterclass over Microsoft Teams that suits this kind of learner well. No previous Power BI experience is required, the course works through real datasets with very little time spent on slides, and each day ends with an optional open session where attendees can raise problems from their own reporting. It costs £600 plus VAT per person and includes 30 days of email support afterwards, which covers the weeks when the first real questions come up. Full details are on Red Eagle Tech’s Masterclass page.
Some businesses would rather have the first version built for them, particularly when the data sits in several systems that don’t talk to each other easily. A London Power BI consultancy such as Red Eagle Tech can take on the build as a defined, fixed-price project, so the cost is agreed before work starts, and then train the team to run and extend it. Plenty of firms combine the two, with a consultant setting up the model and connections while the in-house pack builder learns to take over the reports.
Keeping it useful
A dashboard earns its place by answering the questions people bring to the meeting. Before building anything, ask each person at the Monday meeting to name the three numbers they look at first. The overlap between those lists becomes the front page, and everything else can sit on pages behind it.
Set a date, say three months after launch, to stop producing the old pack entirely. Running both indefinitely doubles the work and keeps people anchored to the spreadsheet. Once the first page has matched the old figures for a few weeks and the team is comfortable clicking around it, retire the matching tabs and move on to the next set.
